Agile software or product development teams use the scrum methodology to complete project tasks in sprints. A Sprint Burndown Chart is a visual representation of the tasks that need to be finished to achieve project delivery success. It helps the stakeholders of the project and the project management team to keep track of the project’s progress against the estimated time allotted for its completion. Though Scrum primarily uses sprint burndown charts, any project can use them to measure progress in relation to the project’s schedule.
Jump ahead to
What is a Sprint Burndown Chart?
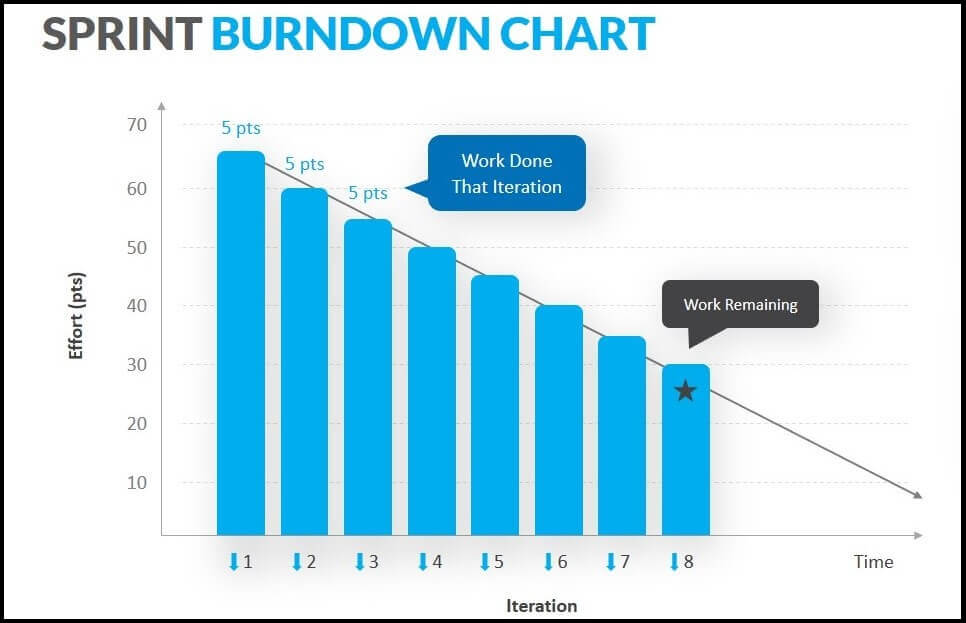
A sprint burndown chart is a visual representation of the remaining tasks against the time allotted to complete them. It is usually shown in a graphical format, with the outstanding work on the vertical axis and the time required to finish the work on the horizontal axis. This makes the work of the Scrum Master (SM) and Product Owner (PO) easier, as they can keep track of the project progress using this graphical representation of the tasks in the form of a burndown chart.
Daily sprint meetings conducted by the SM along with the PO can help the entire product or software development team understand the present stage of the project. This will help decide the required pace the agile teams need to be at to complete the project on schedule. The current performance, also known as the burndown rate, can then be estimated against the sprint goal. Thus, a burndown chart helps make the work transparent for the entire project management team.
Why use a Sprint Burndown Chart?
Agile teams that complete project tasks in short iterations or sprints use the burndown chart. The sprint burndown chart helps them visualize the work needed to be completed against the allocated time. Project managers and product managers can derive the estimated project completion schedule with the help of a burndown chart, as it provides a direct comparison of the work needed to be done and the effort needed to achieve it. Scrum meetings and daily sprint meetings become fruitful when there is a visual representation of the information about the sprint goals. Also, a sprint burndown chart is an effective tool to understand agile team dynamics as it measures the work done by the team to complete the sprints.
Elements of a Sprint Burndown Chart
As discussed above, a burndown chart is a graphical representation of the remaining work needed to be completed versus the time allocated to complete it. However, there are other elements in a sprint burndown chart that helps project managers and product managers predict the estimated project completion schedule.
A sprint burndown chart includes:
X-axis
The horizontal axis of the graph represents the remaining amount of time to complete the project, usually depicted in days.
Y-axis
The vertical axis of the graph represents the effort needed to complete the project.
Actual work line
This represents the actual number of tasks remaining. It might be straight in some cases; however, it often changes due to unforeseen issues in the project or an increase in the number of tasks.
Ideal work remaining line
This represents the estimated task in an ideal scenario.
Story points
Agile teams utilize them to calculate the remaining tasks on both axis.
Sprint goal
This serves as the sprint’s goal, and the graph shows how the actual work has developed in relation to it.
At the start of a particular sprint, all the estimated tasks are summed up, and the hours or days it will take to complete each task are calculated. When all the information is available, the burndown chart can be plotted. Agile teams can update the chart at the end of each day to show progress. The main objective of the sprint burndown chart is to show the actual progress the agile team is making towards the sprint goal.
It is important to understand that a sprint burndown chart assesses sprint objective achievement rather than project delivery achievement. Although it contributes to the overall success of the project, it should not be used as a tool to measure the trajectory of the project itself. Changes caused because of the backlog items or story points are difficult to represent on the chart. Therefore, product owners often use a product backlog along with the burndown chart and a change control process to effectively track the progression of the project.
Significance of a Sprint Burndown Chart
Visualizing the tasks at hand is a great way of tracking the trajectory of a project. A sprint burndown chart is an excellent example of a visualizing tool that helps agile teams keep track of the tasks and improve their efforts to complete them on time. Apart from this, here are some prime benefits of using a sprint burndown chart:
- It serves as a single planning and tracking tool for the estimated work that the entire agile team can use. Thus, eliminating confusion and misunderstanding in finishing the tasks at hand.
- It provides evidence of the tasks needed to complete within the time allocated. This transparency helps the project managers and the stakeholders of the project understand the project resource requirement and allocation.
- It proves the productivity level of the agile team through daily progress reports. Any problems won’t have an impact on the project delivery’s success.
Summary
The Sprint Burndown Chart is a key Agile project management tool that visually tracks daily sprint progress and helps teams stay aligned with sprint goals. It enables early detection of delays, supports better planning, and enhances transparency across Scrum teams and stakeholders. By using a burndown chart consistently, teams can improve accountability and optimize their sprint execution. It also helps avoid scope creep by keeping the workload within planned limits. The chart strengthens data-driven decision-making and boosts team productivity throughout the sprint. Individuals can also refer to Agile and Scrum Interview Questions to deepen their understanding and improve practical application of burndown charts. Its adoption across Agile projects contributes to consistent delivery, improved performance, and successful sprint outcomes.
Conclusions
Sprint burndown charts are effective tools to track and measure tasks against the estimated time. It can help prevent scope creep in projects and help organizations achieve project delivery success. thus, agile teams and scrum teams who work on agile projects regularly use them. Learning about the significance of a sprint burndown chart and how to plot it graphically will help project managers in effectively attaining the project objectives. Skilled and certified agile practitioners are aware of the benefits of a sprint burndown chart and use it to achieve project delivery success for their organizations. These agile practitioners who are looking to deepen their knowledge and enhance their skills, pursuing Scrum-related certification training can be really helpful. Certifications such Scrum Developer Training, Scrum Master Training and Scrum Product Owner Training offered by Unichrone helps in a focused and successfull learning paths and validate your expertise, making you more competitive in this field.
FAQs on Sprint Burndown Chart
1. What is the main purpose of a Sprint Burndown Chart?
It visually tracks the remaining work in a sprint to help teams monitor progress and adjust efforts for timely completion.
2. Is a burndown chart a KPI?
Yes, it acts as a performance indicator by showing if the team is on track with sprint commitments.
3. What is the 3-5-3 rule in Scrum?
It refers to 3 roles, 5 events, and 3 artifacts that form the core structure of Scrum.
4. How often should a sprint burndown chart be updated?
Ideally once a day after the Daily Scrum for accurate progress tracking.
5. What are the four types of Agile?
The primary Agile methodologies include Scrum, Kanban, Lean, and XP (Extreme Programming).
6. Who creates and maintains the sprint burndown chart?
The Scrum Master usually facilitates it, but the Development Team updates it regularly.
7. What are the 4 C’s of Scrum?
Commonly referred to as Commitment, Courage, Collaboration, and Communication.
8. What does an ideal burndown chart look like?
A downward slope showing steady task completion aligned with the sprint timeline.
9. What is the difference between a burndown and burnup chart?
Burndown tracks work remaining; burnup shows work completed toward the total scope.
10. Can a burndown chart help identify scope creep?
Yes, irregular spikes or a flat line in the chart often indicate added work or delays.
11. What tool is commonly used to generate sprint burndown charts?
Tools like Jira, Trello, or Azure DevOps auto-generate burndown charts from sprint boards.
12. Is a burndown chart mandatory in Scrum?
Not mandatory, but highly recommended for transparency and tracking sprint health.
13. How does a burndown chart support Project Management?
It provides real-time insights for planning, resource allocation, timeline adjustments, and stakeholder reporting.
14. Why does a burndown chart not match actual progress sometimes?
It happens when tasks are not updated consistently or when effort estimation is inaccurate.