Quality Management has become a part of every organization that strives to deliver “quality” products and services to their customers and adds value to the business process. Organizations across various industrial sectors from manufacturing and automobile industries to banking and healthcare industries are using quality management tools to improve their business processes and deliver high-quality products to their customers. A Fishbone Diagram is an important quality management tool and is used to find the root cause of a problem. It is one of the seven basic quality tools that quality management professionals use to improve the business processes of their organization.
Jump ahead to
What is a Fishbone Diagram?
The Japanese professor at the University of Tokyo, Kaoru Ishikawa invented the fishbone diagram in the 1960s. At the time, Japan was re-inventing its manufacturing and automobile sectors by introducing the concept of quality management in regular business processes. Kaoru Ishikawa is known to use the fishbone diagram for the first time while working with the Japanese company of Kawasaki. This quality management tool was named the Ishikawa diagram in honor of its creator. Later, it was nicknamed the fishbone diagram due to its similarity with the skeleton of a fish laid on one of its sides.
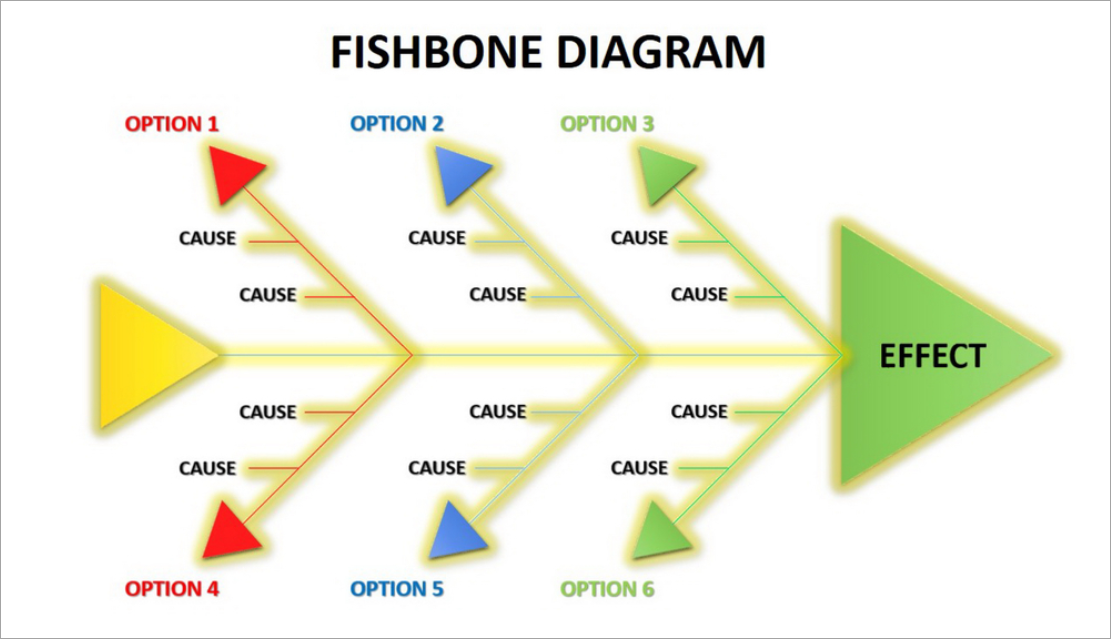
A fishbone diagram is also known as the cause-and-effect diagram, as it helps in finding the root cause of the problem in the business processes of an organization. In the diagram, the head of the fish depicts the problem, and each bone of the spine depicts the potential causes of the problem. Thus, a visual representation of the problem and its potential causes helps quality management professionals who are working to solve the problems in the business process of their organization to successfully identify the root causes of the problem. This root cause analysis tool also helps in brainstorming and finding the right solution to eliminate the problems faced by the organization.
Categories of Causes in a Fishbone Diagram
During the process of finding the potential causes of a specific problem, quality management professionals and quality experts are encouraged to ask as many “why?” questions as they can find. Brainstorming with the quality management team and communicating every aspect of the business processes helps in finding the possible causes of the problem that they need to solve. Every cause and its potential effects can be depicted in the fishbone diagram under categories and sub-categories. These categories may defer according to the nature or domain of the industry; however, the most used categories of causes are – Methods, Machines, Materials, Measurement, People, and Environment.
Methods
This category of causes is for documents and instructions during the operations of a particular business process where the defect has been found.
Machines
This category is for all the elements related to the equipment or machines used in the business process.
Materials
The raw materials or similar resources used during the business process are represented under this category.
Measurement
Quality standards or measurement units used in the business process are depicted in this category.
People
All the people or manpower that are involved or are associated with the business process are mentioned here.
Environment
This category is for the external factors that affect the general functioning of the business process like the temperature of the work area, storage conditions, and such.
Fishbone Root Cause Analysis
After identifying the problems in the business process through brainstorming, quality management professionals create the final problem statement. Then, the fishbone diagram can be created using marking pens and whiteboards or through online tools according to their preference. The problem that the quality management professionals are trying to solve goes at the head of the fishbone diagram. Each bone represents the causes categories as mentioned above. Sub-categories are included to find the effects of the causes also known as sub-causes. If two cause categories have the same sub-causes that must be depicted in the diagram as well.
The process needs to be repeated until all the causes and sub-causes are represented in the fishbone diagram. Only then, quality experts can brainstorm again and use other quality management tools to solve the problem and improve the business process of their organization. The fishbone diagram is a simple yet effective quality management tool that helps in root cause analysis. Using this powerful root cause analysis tool, organizations can identify and rectify the problems that are creating quality issues for them. Thus, by improving the quality of their business process, organizations can deliver high-quality products and services for their customers.
Summary
In quality management, the Fishbone Diagram stands out as an essential framework for systematic problem-solving. It allows professionals to visually track the origins of a defect or inefficiency and categorize them for better analysis. Widely adopted across industries, it promotes teamwork and data-driven discussions. Applying this diagram enables companies to improve quality metrics and achieve process excellence. Its simplicity and effectiveness make it a preferred tool for continuous improvement initiatives.
Conclusion
Organizations around the world are trying to improve their daily business operations to outdo their competitors. Customers trust and buy products from those organizations that have proven their quality standards. Therefore, a thorough understanding of the fishbone diagram as well as the seven basic quality management tools is a must for every aspiring quality management professional. Without an in-depth comprehension of these quality management tools, quality management and quality control are impossible. Aspiring quality management professionals can use quality management training and certification provided by Reputed Professional Training Providers to improve their quality management knowledge and skills further.
FAQs on Fishbone Root Cause Analysis
1. What is the Fishbone Diagram in quality management?
It’s a visual tool used to identify, organize, and analyze the root causes of quality-related problems.
2. Why is it called a Fishbone Diagram?
Its structure looks like a fish skeleton, with the problem as the head and causes as bones.
3. What is another name for the Fishbone Diagram?
It’s also called the Ishikawa Diagram or Cause-and-Effect Diagram.
4. What is the purpose of a Fishbone Diagram?
It helps teams find and fix the root cause of issues instead of treating surface-level symptoms.
5. What are the main categories in a Fishbone Diagram?
Common categories include People, Methods, Machines, Materials, Measurement, and Environment.
6. What are the 5 M’s of Fishbone?
The 5 M’s stand for Man, Machine, Method, Material, and Measurement, used in manufacturing analysis.
7. What are the 5 P’s of Fishbone?
The 5 P’s are People, Process, Policies, Place, and Procedures—used mainly in service-based industries.
8. What are the 6 steps of the Fishbone Diagram?
Define the problem, identify categories, brainstorm causes, draw the diagram, analyze, and implement actions.
9. When should a Fishbone Diagram be used?
Use it when facing recurring or complex problems that require structured root-cause analysis.
10. Is the Fishbone Diagram one of the seven quality tools?
Yes, it’s one of the seven basic tools used in quality improvement and process control.
11. How is the Fishbone Diagram different from the 5 Whys?
The Fishbone maps multiple causes visually, while 5 Whys digs deeper into a single cause chain.
12. How does the Fishbone Diagram improve quality?
It identifies weak points in processes, helping teams fix the root cause and prevent defects.
13. Can the Fishbone Diagram be used outside manufacturing?
Yes, it’s applied in healthcare, IT, education, and service sectors for process improvement.
14. Why is the Fishbone Diagram important for continuous improvement?
It provides a structured way to solve problems, leading to long-term quality and efficiency gains.