Quality improvement has become crucial for all organizations operating in various industrial sectors. Every organization aims to maintain and sustain the “quality” of the product and services throughout the production process. In addition, Customers are only willing to pay for high-quality products and services. Therefore, organizations should strive to meet their customer’s requirements by improving their business processes and delivering high-quality products and services. They can accomplish these tasks by using the 7 Quality Control Tools of Quality Management.
Jump ahead to
History of 7 QC Tools of Quality Management
There are seven quality control tools in quality management for process improvement, which originated in post-war Japan. Kaoru Ishikawa, a professor of Engineering at Tokyo University, introduced these 7 QC Tools of Quality Management. Since these tools are basic and easy to use. This helped workers effectively improve the quality of the business process. As a result, Japan has become one of the first nations to produce high-quality products. The tool not only fulfilled the requirements of the customers but also helped generate a huge amount of profit for the organizations. Earlier, the quality improvement concept was used only in the manufacturing industries. Later, it extended to a wide range of other sectors, including finance, healthcare, government, and pharmaceuticals.
When the quality improvement concept reached the West, the automotive and manufacturing industries in America developed it further to match the high-quality production processes of their competitors in Japan. This resulted in the introduction of the concepts of Lean and Six Sigma, which became the fundamentals of Quality Management. However, the 7 QC Tools are still in practice along with the new process improvement methodologies of Lean, Six Sigma, TQM (Total Quality Management), and Lean Six Sigma. Hence, the seven quality control tools of quality management are believed to be the gold standards for process improvement.
7 Basic Quality Control (QC) Tools
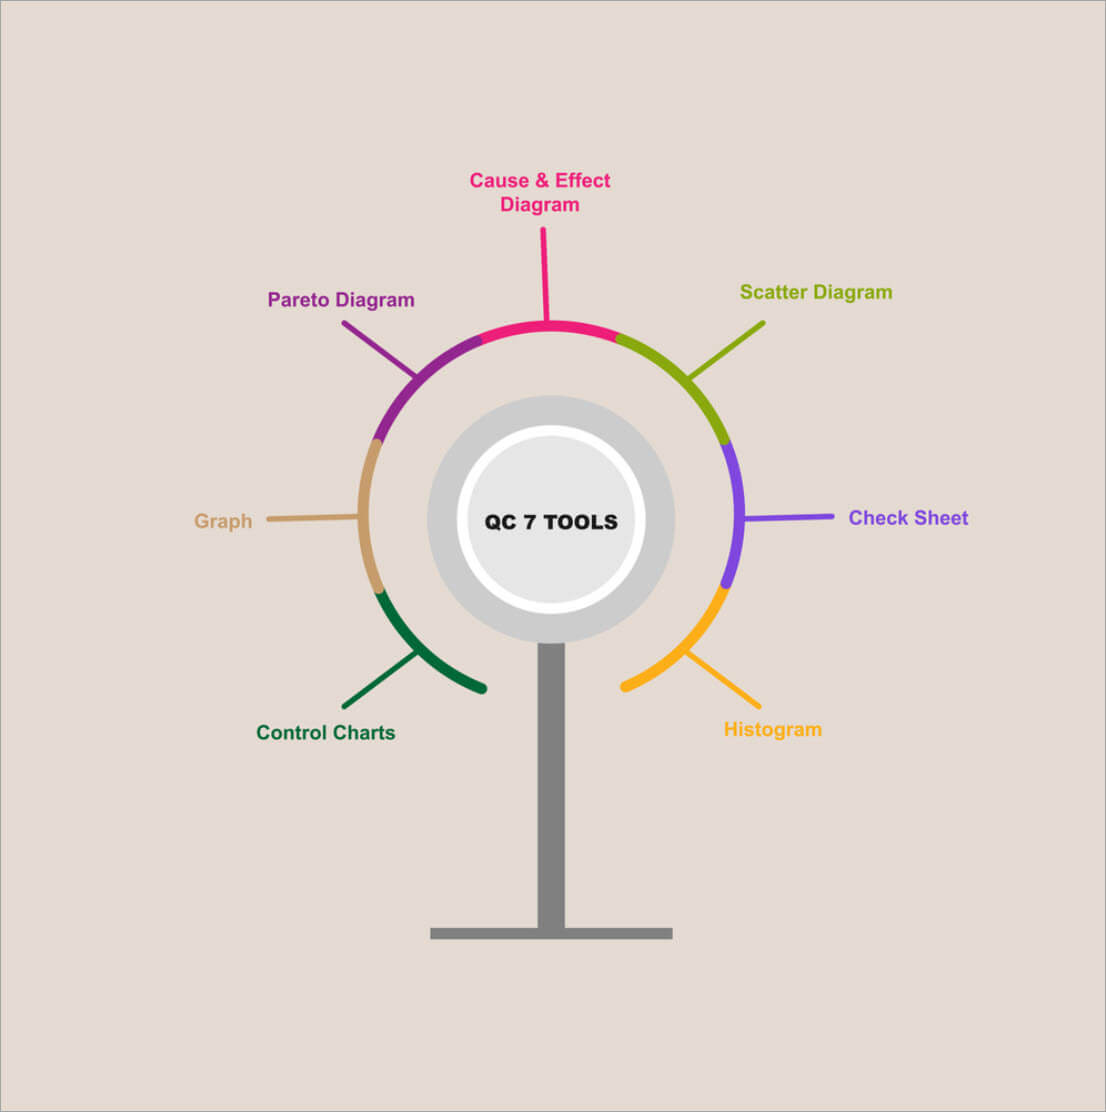
The 7 Basic Quality Control (QC) Tools for Process Improvement in Quality Management are Cause-and-effect diagrams (Fishbone or Ishikawa diagram), Scatter diagrams, Histograms, Control charts, Pareto charts, Check sheets, and Stratification. With the use of these tools, professionals can derive the most information possible from the data they collect, analyze, and interpret.
Fishbone or Ishikawa Diagram
The Fishbone or Ishikawa Diagram is also known as the cause-and-effect diagram, introduced by Kaoru Ishikawa. It helps users to identify the causes or factors of the effect or problem and solve them accordingly. Ishikawa Diagram looks like a fish’s skeleton with the fish head to the right of the diagram and the bones branching off behind it to the left. It helps in identifying the root cause of the problem and improving the business process by finding the solution to the effect.
Scatter Diagram
Scatter Diagram or scatter plot is a statistical quality control tool. The scatter diagram serves the same purpose as the fishbone diagram while establishing a relationship between the causes and the overall effect. These are depicted as variables – X and Y and are used by quality management professionals to analyze the relationship between the two variables. After establishing the relation, professionals can start working toward finding the solution to the problems. Professionals can use any number of independent and dependent variables to create a scatter plot.
Histogram
Histogram was introduced by Karl Pearson. A histogram is a bar graph that shows the frequency distribution on each bar. It is used to study the areas of improvement that are needed at any given point in time in the production process. Quality professionals use this tool for studying various data like days of the week, physical measurements, the time needed to complete tasks, etc. Furthermore, Histogram helps in analyzing and interpreting the actions of various data sets to control quality.
Control Chart
This quality control tool is also called the Shewhart chart after Walter A. Shewhart. A Control Chart is a statistical chart used to determine the stability and predictability of the process over time. It helps in reducing process variation by comparing the current data to historical data. Moreover, Control Chart helps in decision making for process improvement goals.
Pareto Chart
This QC Tool named after Vilfredo Pareto is used to determine the biggest contributors to a particular problem. Identifying these factors will help quality management professionals adjust to the causes and rectify the problem easily. Pareto chart is represented in a combination of bar graph and line graph. The 80-20 rule, which claims that 20% of the key factors account for 80% of an issue, is the foundation of the Pareto chart. The remaining 20% of the problem is caused by small elements that together account for 80% of the problem.
Check Sheet
Professionals utilize check sheets to collect quantitative or qualitative data. This quality control tool is called a tally sheet when it’s used for collecting quantitative data. The purpose of a check sheet is to list important data or information in a table and check their status. This helps in understanding the progress of the production process, find patterns, and solve problems.
Stratification
This quality control and assurance tool is also called a flowchart or run chart. Stratification divides data into categories and classifies them into groups. Depicting data in a visual representation helps quality professionals derive meaningful information from them, ultimately leading to process improvement. Moreover, Stratification improves understanding of the process, and identifies inefficiencies or bottlenecks.
Importance of 7 QC Tools of Quality Management
The 7 QC Tools can be used in collaboration with other quality management methodologies. For example, in the Define stage of the DMAIC phases of Lean Six Sigma, Flowcharts are used. Fishbone diagrams, Pareto charts, and Control charts are used in the Measure stage. Scatter diagrams, Histograms, and Check sheets are utilized to analyze data in the Analyze stage. Control charts are used in the Improve and Control phases of Six Sigma.
Conclusion
Knowledge of seven basic quality control tools will help organizations improve their business processes and increase productivity. The 7 QC Tools are easy to understand. However, having in-depth knowledge of these tools will provide more opportunities for Quality Management professionals working on various Six Sigma projects. Therefore, candidates interested in gaining expertise in 7 QC tools can opt for Certified 7QC Tools Practitioner Certification Training. Training gives professionals knowledge and hands-on experience in understanding the 7 QC Tools of Quality Management. This will be very beneficial for quality management professionals while working in the organizations.
FAQs
What are 7 QC Tools of Quality Management?
7 QC Tools are basic and effective tools used to improve quality and efficiency in various industries. They include fishbone diagram, scatter diagram, histogram, control chart, pareto chart, check sheet, and stratification.
Who introduced 7 QC Tools?
Kaoru Ishikawa, a Japanese quality control expert, introduced 7 QC Tools.
What is the purpose of Fishbone Diagram?
Fishbone Diagram, also known as cause-and-effect diagram, helps identify the root causes of a problem. It visually represents the relationship between the problem (effect) and its potential causes.
What is the purpose of Control Chart?
Control Chart is used to monitor a process over time and identify trends or shifts in the process. It helps detect and address potential problems before they become significant.
What is the purpose of Pareto Chart?
Pareto Chart is used to prioritize problems or causes based on their frequency or impact. It helps focus on the most critical issues for improvement.
What is the purpose of Check Sheet?
Check Sheet is a simple data collection tool used to record occurrences of specific events or characteristics. It helps identify patterns and trends in the data.
What is the purpose of Stratification?
Stratification is a technique used to divide data into smaller, more homogeneous groups. It helps identify patterns and differences within the data.
How are 7 QC Tools used in Lean Six Sigma?
7 QC Tools are integrated into the DMAIC (Define, Measure, Analyze, Improve, Control) phases of Lean Six Sigma. They are used for data collection, analysis, and problem-solving throughout the process.