Root Cause Analysis is a disciplined approach to analyze data. It not only identifies the symptoms but also the underlying cause of the problem. RCA does not provide a temporary fix for the problem but acts like a band-aid for that. This reduces wastage in terms of time and resources. As we can gather from its name, it pinpoints the root cause of the problem. After getting a hold of the root cause, we can move forward to resolve the issues. In other words, we can say that RCA is a valuable tool for those organizations that are looking forward to improving their output. This analysis results in saving time, money, and valuable resources. Now that we get a hold of what Root Cause Analysis means, let us move forward to its tools.
Examples:
- A manufacturing company uses RCA to identify the root cause of a quality defect in their output.
- Hospitals uses RCA for medical errors
- Software companies use RCA for debugging.
Jump ahead to
Root Cause Analysis Tools
Root Cause Analysis tools help in ensuring Quality Management. Whichever domain you choose to work in, quality is the priority for everyone, everywhere. To ensure and support quality management, root cause analysis tools come into action. They identify a problem and find the root cause of the issue we’re dealing with. Their sole purpose is not only to identify the problem but also to provide measures to deal with it.
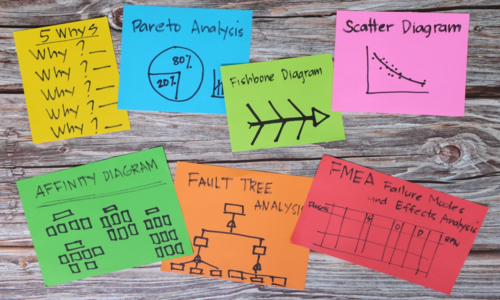
There are several tools, but here we are going to learn Six Sigma Root Cause Analysis tools. Let’s dive right in:
Pareto Charts
Quality Management professionals use Pareto charts, also known as Pareto diagrams, as tools. They are a combination of bar graphs and line graphs. These charts detect the potential issue or problem and carry out the probable solutions for the same to ensure quality. In these charts, the bars present themselves in descending order. The purpose of using this Root Cause Analysis Tool is that it collects the data and represents it in the form of charts for people to understand it.
These charts work on Pareto Principles of Root Cause Analysis. This principle states that 20% of the causes determine 80% of the results. Professionals should also focus on the fact that this principle does not always work. So, they should not only rely on this principle.
In this modern era, these Pareto charts and/or diagrams determine the most critical and complex issues across different departments. This analysis avoids wasting the project’s or organization’s most scarce resource by identifying and addressing the critical issues that require our immediate attention or focus.
Failure Mode And Effect Analysis (FMEA)
Failure Mode and Effect Analysis (FMEA) is a step-by-step process for collecting information. The project or design team carries out knowledge of potential failures and their possible effects based on the provided information. It is a two-way process; the first is failure mode. It is a risk-measuring tool that scales from 1 to 10. If the risk scale is at 1, then the risk is low, while 10 shows a very high risk.
In Failure Mode, we determine all the possible ways that may cause a failure or breakdown in a project. It affects the customer, as it includes all the errors. For example, for some reason, your water tap is not working. In that case, you would carry out all the potential reasons for that, like the pipes are not working or there is something wrong with the tap, etc., which are the potential causes of failure.
In Effect Analysis, we involve all the consequences of the failure. We perform this analysis to ensure that we detect all failures or breakdowns. By examining how frequently those failures occur and determining which failures should be prioritized first, it is done. This is to ensure that the failures or breakdowns that need our immediate attention are being attended to.
By proactively analyzing the failures before their occurrence, we may use this root cause analysis tool to identify possible issues before they arise. We might save a lot of time and money by identifying these mistakes early on and assessing how they might affect other people. This analytical tool minimizes the impact of the issue by analyzing and pointing it out.
5 Whys
The 5 whys technique is a traditional tool for RCA. It was first introduced in the 1930s. Then in the 1970s, it reached its peak of popularity. So, what is this 5 Whys method?
Its technique is true to its philosophy and its traditions, people consider it the most effective problem-solving method. This technique is as simple as writing the alphabet; whenever a problem occurs, your instant response to that should be Why? five times. Then the answer or the cause becomes apparent; we just need to work on that cause. However, this technique is not suitable for a complex or critical situation as it focuses solely on a single problem. If we keep on going with this technique in a complex situation, all the other problems that require our attention would be left out.
5 Whys technique stands out as one of the most accessible among other analytical techniques as it doesn’t require extensive critical thinking in forming the solutions. Simply asking WHY to each of the issues being stated towards us. The answers to all those WHYS would ultimately lead us toward the root cause. With this, we could state that the 5 Whys analysis systematically peels back the layers of analysis.
Ishikawa Fishbone Diagram
This RCA tool is used by individuals to solve critical and complex problems. For the problems for which we are not able to identify the root cause, we need brainstorming process to be introduced. First, we identify a problem and then we carry out all potential causes for that problem. Breaking those potential causes into subcategories one after another causes them to link back to the main problem to investigate the root cause of the problem. Investigators continue the investigation till they find the exact cause.
This Fishbone diagram’s visual map reveals the relationship between the potential cause and the problem which makes it easier to trace it back to its origin. This comprehensive overview of the project or the business information gives clarity for project managers to streamline the analysis of the problem.
Fault Tree Analysis
This analysis is also known as Event Tree Analysis. This method identifies possible causes of failure in a project. In this analysis, we graphically illustrate and diagrammatically show the different potential causes of the failure. It makes the identification of the cause easy. With the diagram, we can identify the problem and the cause of its occurrence.
This analysis works on three major steps:
- Creation of FTA.
- identifying all the contributing factors.
- Evaluation of failures and their contributing factors.
Scatter Diagram
A scatter diagram is also known as a scatter plot. We take two sets of data and then we show the visual representation of their relationship. In simple words, it is a quantitative method that tests the correlation between two sets of data. In this analysis tool, we plot the root cause of the problem on the x-axis and the dependent effect on the y-axis to determine the suspected cause. If the patterns intersect each other in this diagram, forming a clear line or curve, we can determine that they correlate to each other.
Scatter diagram highlights the patterns and trends in the data between variables and demonstrates how these affect each other. This helps us state that different factors which are not related to each other can still affect the project. As we can gather from its name, it focuses on two potential variables by illuminating a clear relationship between them and by providing valuable insight for root cause analysis.
Summary
Root Cause Analysis (RCA) tools are essential for identifying, analyzing, and eliminating the true causes of recurring issues. By using methods like the 5 Whys, Fishbone Diagram, Pareto Analysis, and FMEA, organizations can improve process efficiency, quality, and reliability. These tools empower professionals to make data-driven decisions and foster continuous improvement across industries. Understanding and applying RCA tools effectively leads to sustainable problem-solving and long-term business success.
Enhance your analytical and problem-solving skills—Enroll in Unichrone’s Certification Training today and master powerful RCA tools for quality excellence!
Conclusion
All these six tools work as detectives in figuring out the root cause of the failure of a project. They offer techniques that are unique in their own way. A single tool or technique in Root Cause Analytic Tools can sometimes not work alone, but a blend of them could surely lead us towards the solution of the failure. These RCA Tools not only identify the root cause of the failure but also suggest measures for its prevention. We should tailor our approach to every step. To gain command over these root cause analysis tools a professionals can take up RCA Through Six Sigma Training program.
FAQs RCA Tools
1. What are Root Cause Analysis (RCA) tools?
Root Cause Analysis (RCA) tools are structured methods used to identify the underlying causes of problems, failures, or defects. These tools help organizations go beyond surface-level symptoms to find the real source of issues and implement effective.
2. Why is Root Cause Analysis important?
RCA is important because it promotes continuous improvement and prevents the same issues from happening again. By identifying the true cause of a problem, organizations can save time and maintain consistent quality across products and processes.
3. What are the most common Root Cause Analysis tools?
The most widely used RCA tools include the- Fishbone Diagram (Ishikawa), Pareto Analysis, Failure Mode and Effects Analysis (FMEA), and Fault Tree Analysis (FTA).
4. How does a Fishbone Diagram help in Root Cause Analysis?
A Fishbone Diagram, also known as an Ishikawa Diagram, visually categorizes potential causes of a problem into key areas such as People, Methods, Machines, Materials, Environment, and Measurement.
5. What is the difference between corrective and preventive actions in RCA?
Corrective actions address existing problems by eliminating their root cause, ensuring they don’t reoccur. Preventive actions, however, are proactive measures taken to prevent potential issues before they happen, strengthening processes and improving overall system reliability.
6. What is the Pareto Analysis in RCA?
Pareto Analysis helps prioritize problems by showing that 80% of effects come from 20% of causes. In RCA, it identifies the most significant issues that need attention first, allowing teams to focus on high-impact improvements.
7. What industries use Root Cause Analysis tools?
RCA tools are widely used across industries such as manufacturing, healthcare, aviation, energy, IT, and finance. These sectors rely on RCA to improve safety, quality, process reliability, and compliance while reducing downtime and operational costs.
8. What are the benefits of Root Cause Analysis (RCA) tools?
RCA tools help organizations achieve long-term improvement by preventing problem recurrence, enhancing quality, and improving customer satisfaction. They promote a culture of accountability, data-driven decision-making, and continuous process optimization.
9. What are the key steps involved in conducting Root Cause Analysis?
The key steps in conducting RCA include problem identification, data collection, cause analysis using tools, developing corrective actions, implementing solutions, and monitoring effectiveness to ensure the issue does not reoccur
10. How does Root Cause Analysis support continuous improvement?
Root Cause Analysis supports continuous improvement by identifying the fundamental reasons behind process inefficiencies or failures. By addressing these root causes, organizations can enhance performance and implement sustainable changes that lead to long-term operational excellence.